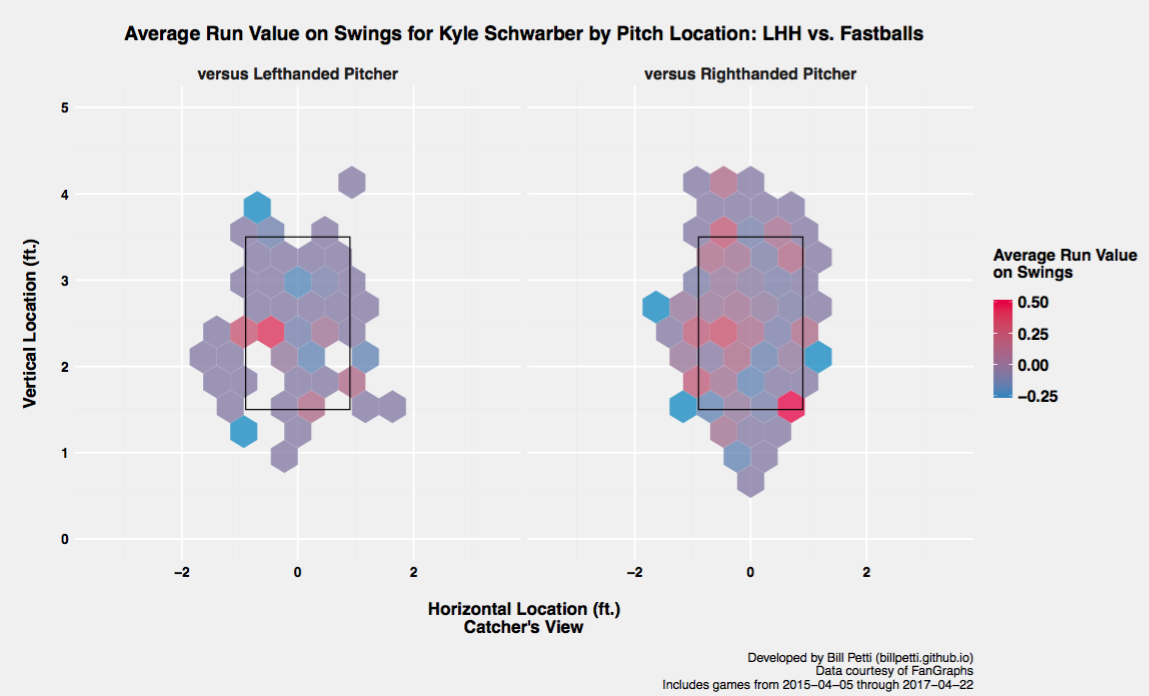
I created a function for quickly creating reports for Major League teams that include heatmaps for hitters based on pitcher handedness and the type of pitch. The function isolates a team’s active roster, produces heatmaps using ggplot2 for each hitter, and then binds all the heatmaps together in a pdf. The data includes all swings from 2015 to the present.
Here’s an example:

Reports for all 30 teams can be found in a public Dropbox folder here.
I’ll be updating these daily, so always sort by the date modified to get the most up to date versions for each team. Day-to-day, much shouldn’t change, but as the season progresses there will be injuries, call-ups, trades, etc., that will change the composition of each team’s active roster. These can be a nice one-stop reference as teams head into a new series.
The entire data pipeline is written in R and the data comes courtesy of the writer’s database at FanGraphs.