Aggregated statistics for minor league players have been available for some time through sites like FanGraphs, Baseball-Reference, and MiLB.com. However, pitch-level data similar to what is availabel for MLB is not easy to find.
To try and fill that gap, I’ve added and updated functions in baseballr that allow a user to query data through MLB’s stats api at the minor league level. This isn’t a perfect solution, nor is it as easy to grab data at a player level like can be done for major leaguers at Baseball Savant, but it’s a start.
MILB Game Data
Before grabbing pitch-by-pitch (pbp) data, we need some information at the game level. To obtain this information, you can use the get_game_pks_mlb function. Simply provide a datea and a numeric vector for what levels you want game information returned.
You can view a look up table with ?get_game_pks_mlb to get the appropriate IDs, but I’ll post them here as well (this is not comprehensive):
| 1 | MLB |
|---|---|
| 11 | Triple-A |
| 12 | Double-A |
| 13 | Class A Advanced |
| 14 | Class A |
| 15 | Class A Short Season |
| 5442 | Rookie Advanced |
| 16 | Rookie |
| 17 | Winter League |
You can provide more than one level at a time. Say you want all games played on 2019-05-01 across Triple-A and Double-A:
require(baseballr)
require(tidyverse)

games <- get_game_pks_mlb(date = '2019-05-01',
                          level_ids = c(11, 12))

games %>%
  select(game_pk, gameDate, teams.away.team.name, teams.home.team.name) %>%
  slice(1:10)

   game_pk             gameDate      teams.away.team.name  teams.home.team.name
1   579921 2019-05-01T16:05:00Z        Round Rock Express Oklahoma City Dodgers
2   579919 2019-05-01T03:33:00Z        Round Rock Express Oklahoma City Dodgers
3   584340 2019-05-01T21:30:00Z        Midland RockHounds        Tulsa Drillers
4   584269 2019-05-01T03:33:00Z        Midland RockHounds        Tulsa Drillers
5   579571 2019-05-01T21:38:00Z      San Antonio Missions             Iowa Cubs
6   579570 2019-05-01T03:33:00Z      San Antonio Missions             Iowa Cubs
7   571587 2019-05-01T14:30:00Z            Erie SeaWolves         Altoona Curve
8   572288 2019-05-01T14:30:00Z New Hampshire Fisher Cats       Trenton Thunder
9   575163 2019-05-01T14:35:00Z             Norfolk Tides          Durham Bulls
10  575655 2019-05-01T14:35:00Z           Louisville Bats       Toledo Mud Hens
You can also use the get_game_info_mlb function to grab additional info on each game, such as weather and (in some cases) attendance:
map_df(.x = games$game_pk[1:10],
       ~get_game_info_mlb(.x)) %>%
  select(game_date, venue_name, temperature, other_weather, wind)

# A tibble: 10 x 5
   game_date  venue_name                 temperature other_weather wind
   <chr>      <chr>                      <chr>       <chr>         <chr>
 1 2019-05-01 Chickasaw Bricktown Ballp… 63          Cloudy        4 mph, R To L
 2 2019-05-01 Chickasaw Bricktown Ballp… 72          Cloudy        13 mph, R To L
 3 2019-05-01 ONEOK Field                77          Overcast      14 mph, In Fro…
 4 2019-05-01 ONEOK Field                74          clear         14 mph, In Fro…
 5 2019-05-01 Principal Park             54          Overcast      3 mph, In From…
 6 2019-05-01 Principal Park             53          Overcast      1 mph, Calm
 7 2019-05-01 Peoples Natural Gas Field  58          Overcast      7 mph, In From…
 8 2019-05-01 ARM & HAMMER Park          55          Overcast      5 mph, L To R
 9 2019-05-01 Durham Bulls Athletic Park 70          Partly Cloudy 7 mph, In From…
10 2019-05-01 Fifth Third Field          59          Cloudy        7 mph, R To L
MiLB Pitch-by-Pitch Data
Once you have the game_pk IDs grabbing the pbp data is very simple. All you need to do is pass the game_pk of interest to the get_pbp_mlb function.
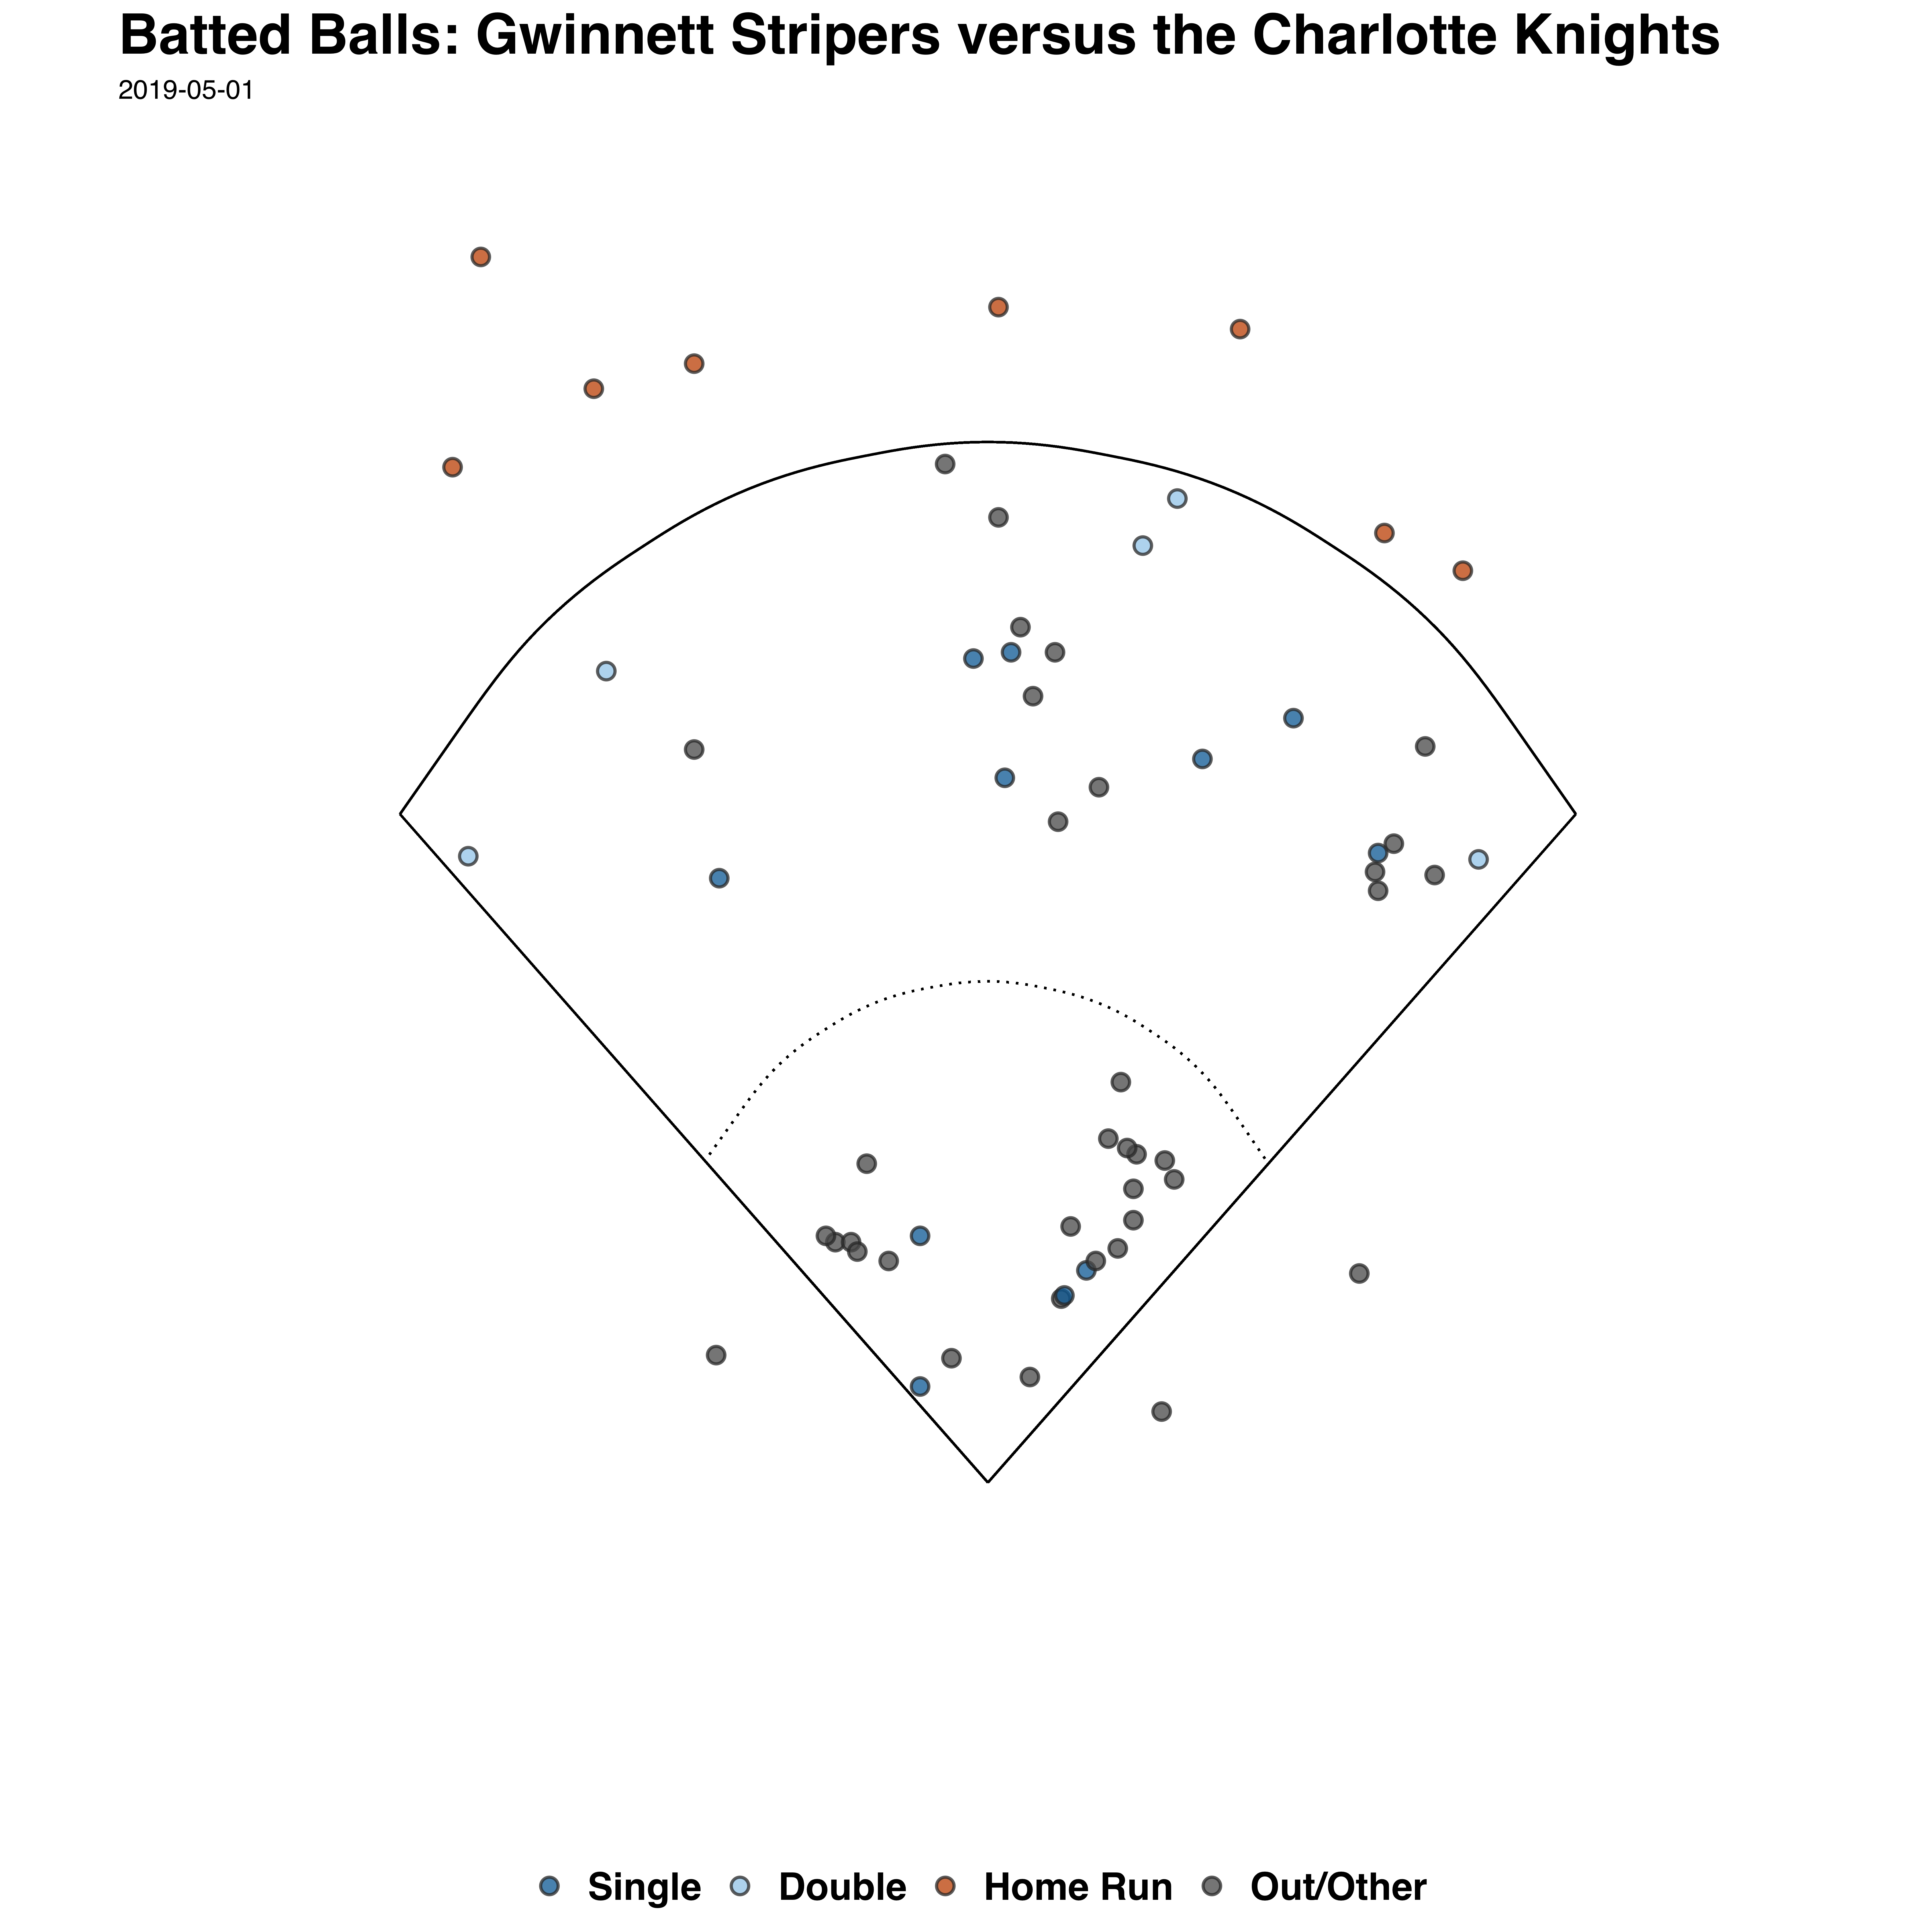
Let’s say you interested in the Gwinnett Stripers versus the Charlotte Knights:
payload <- get_pbp_mlb(575589)
The function will return a data frame with 131 columns. Data availability will vary depending on the park and the league level, as most sensor data is not availble in minor league parks via this API. Also note that the column names have mostly been left as-is and there are likely duplicate columns in terms of the information they provide. I plan to clean the output up down the road, but for now I am leaving the majority as-is.
Some of the colums of interest at the minor league level are:
pitchNumberandatBatIndex: the pitch number within a given plate appearance and the plate appearance within a given game.pitchData.coordinates.xandpitchData.coordinates.y: the x,z coordinates of the pitch as it crosses the plate. As far as I can tell, these are the pixel coordinates for a location that a stringer manually plots and likely need to be transformed and rotated to get a view of the pitch as it crosses the plate. I am working on figuring out an easy transformation to get them on the same scale as the MLB coordinates, but they appear different by park. I do believe you can multiple both by -1 and that will at least allow you to orient the coordinates correctly (i.e. catcher’s view)details.call.code,details.call.description,result.event,result.eventType, andresult.description: these are similar to what we find with Statcast data–codes and detailed desriptions for what happened on a pitch or at the end of a plate appearance.count.variables that tell you how many balls, strikes, and outs before and after the pitch.batter.idandpitcher.idmatchup.batSide.codeandmatchup.pitchHand.code: handedness of the batter and pitcher.- A series of columns that tell you what the league and level is of both the home and away teams and includes their parent organizations.
batted.ball.result,hitData.coordinates.coordX,hitData.coordinates.coordY,hitData.trajectory: various information about the batted ball. Of most interest will be the coordinate columns.
We can easily plot batted balls with this data:
bb_palette <- c('Single' = "#006BA4",
                'Double' = "#A2CEEC",
                'Triple'= "#FFBC79",
                'Home Run'= "#C85200",
                'Out/Other' = "#595959")

ggspraychart(payload,
             x_value = 'hitData.coordinates.coordX',
             y_value = '-hitData.coordinates.coordY',
             fill_value = 'batted.ball.result',
             fill_palette = bb_palette,
             point_size = 3) +
  labs(title = 'Batted Balls: Gwinnett Stripers versus the Charlotte Knights',
       subtitle = '2019-05-01')
As I mentioned, getting pbp data for a single player or team is problematic given that the api call is game-based. (This is as far as I can tell without formal documentation.)
For players, you will likely need to collect data in bulk and house it in your own database to make querying far easier. However, here’s an example of how you might get all pbp data for all teams in a single MLB team’s system for a given week.
First, grab all game_pks for the first week of June 2019 for all levels from Triple-A to Class A:
x <- map_df(.x = seq.Date(as.Date('2019-06-01'),
                          as.Date('2019-06-07'),
                          'day'),
            ~get_game_pks_mlb(date = .x,
            level_ids = c(11,12,13,14,15))
)
Next, map over those game_pks and run the get_pbp_mlb function for each (Note: you are making hundreds of api calls, so this will take about 5 minutes):
safe_milb <- safely(get_pbp_mlb)

# filter the game files for only those games that were completed and pull the game_pk as a numeric vector

df <- map(.x = x %>%
            filter(status.codedGameState == "F") %>%
            pull(game_pk),
          ~safe_milb(game_pk = .x)) %>%
  map('result') %>%
  bind_rows()
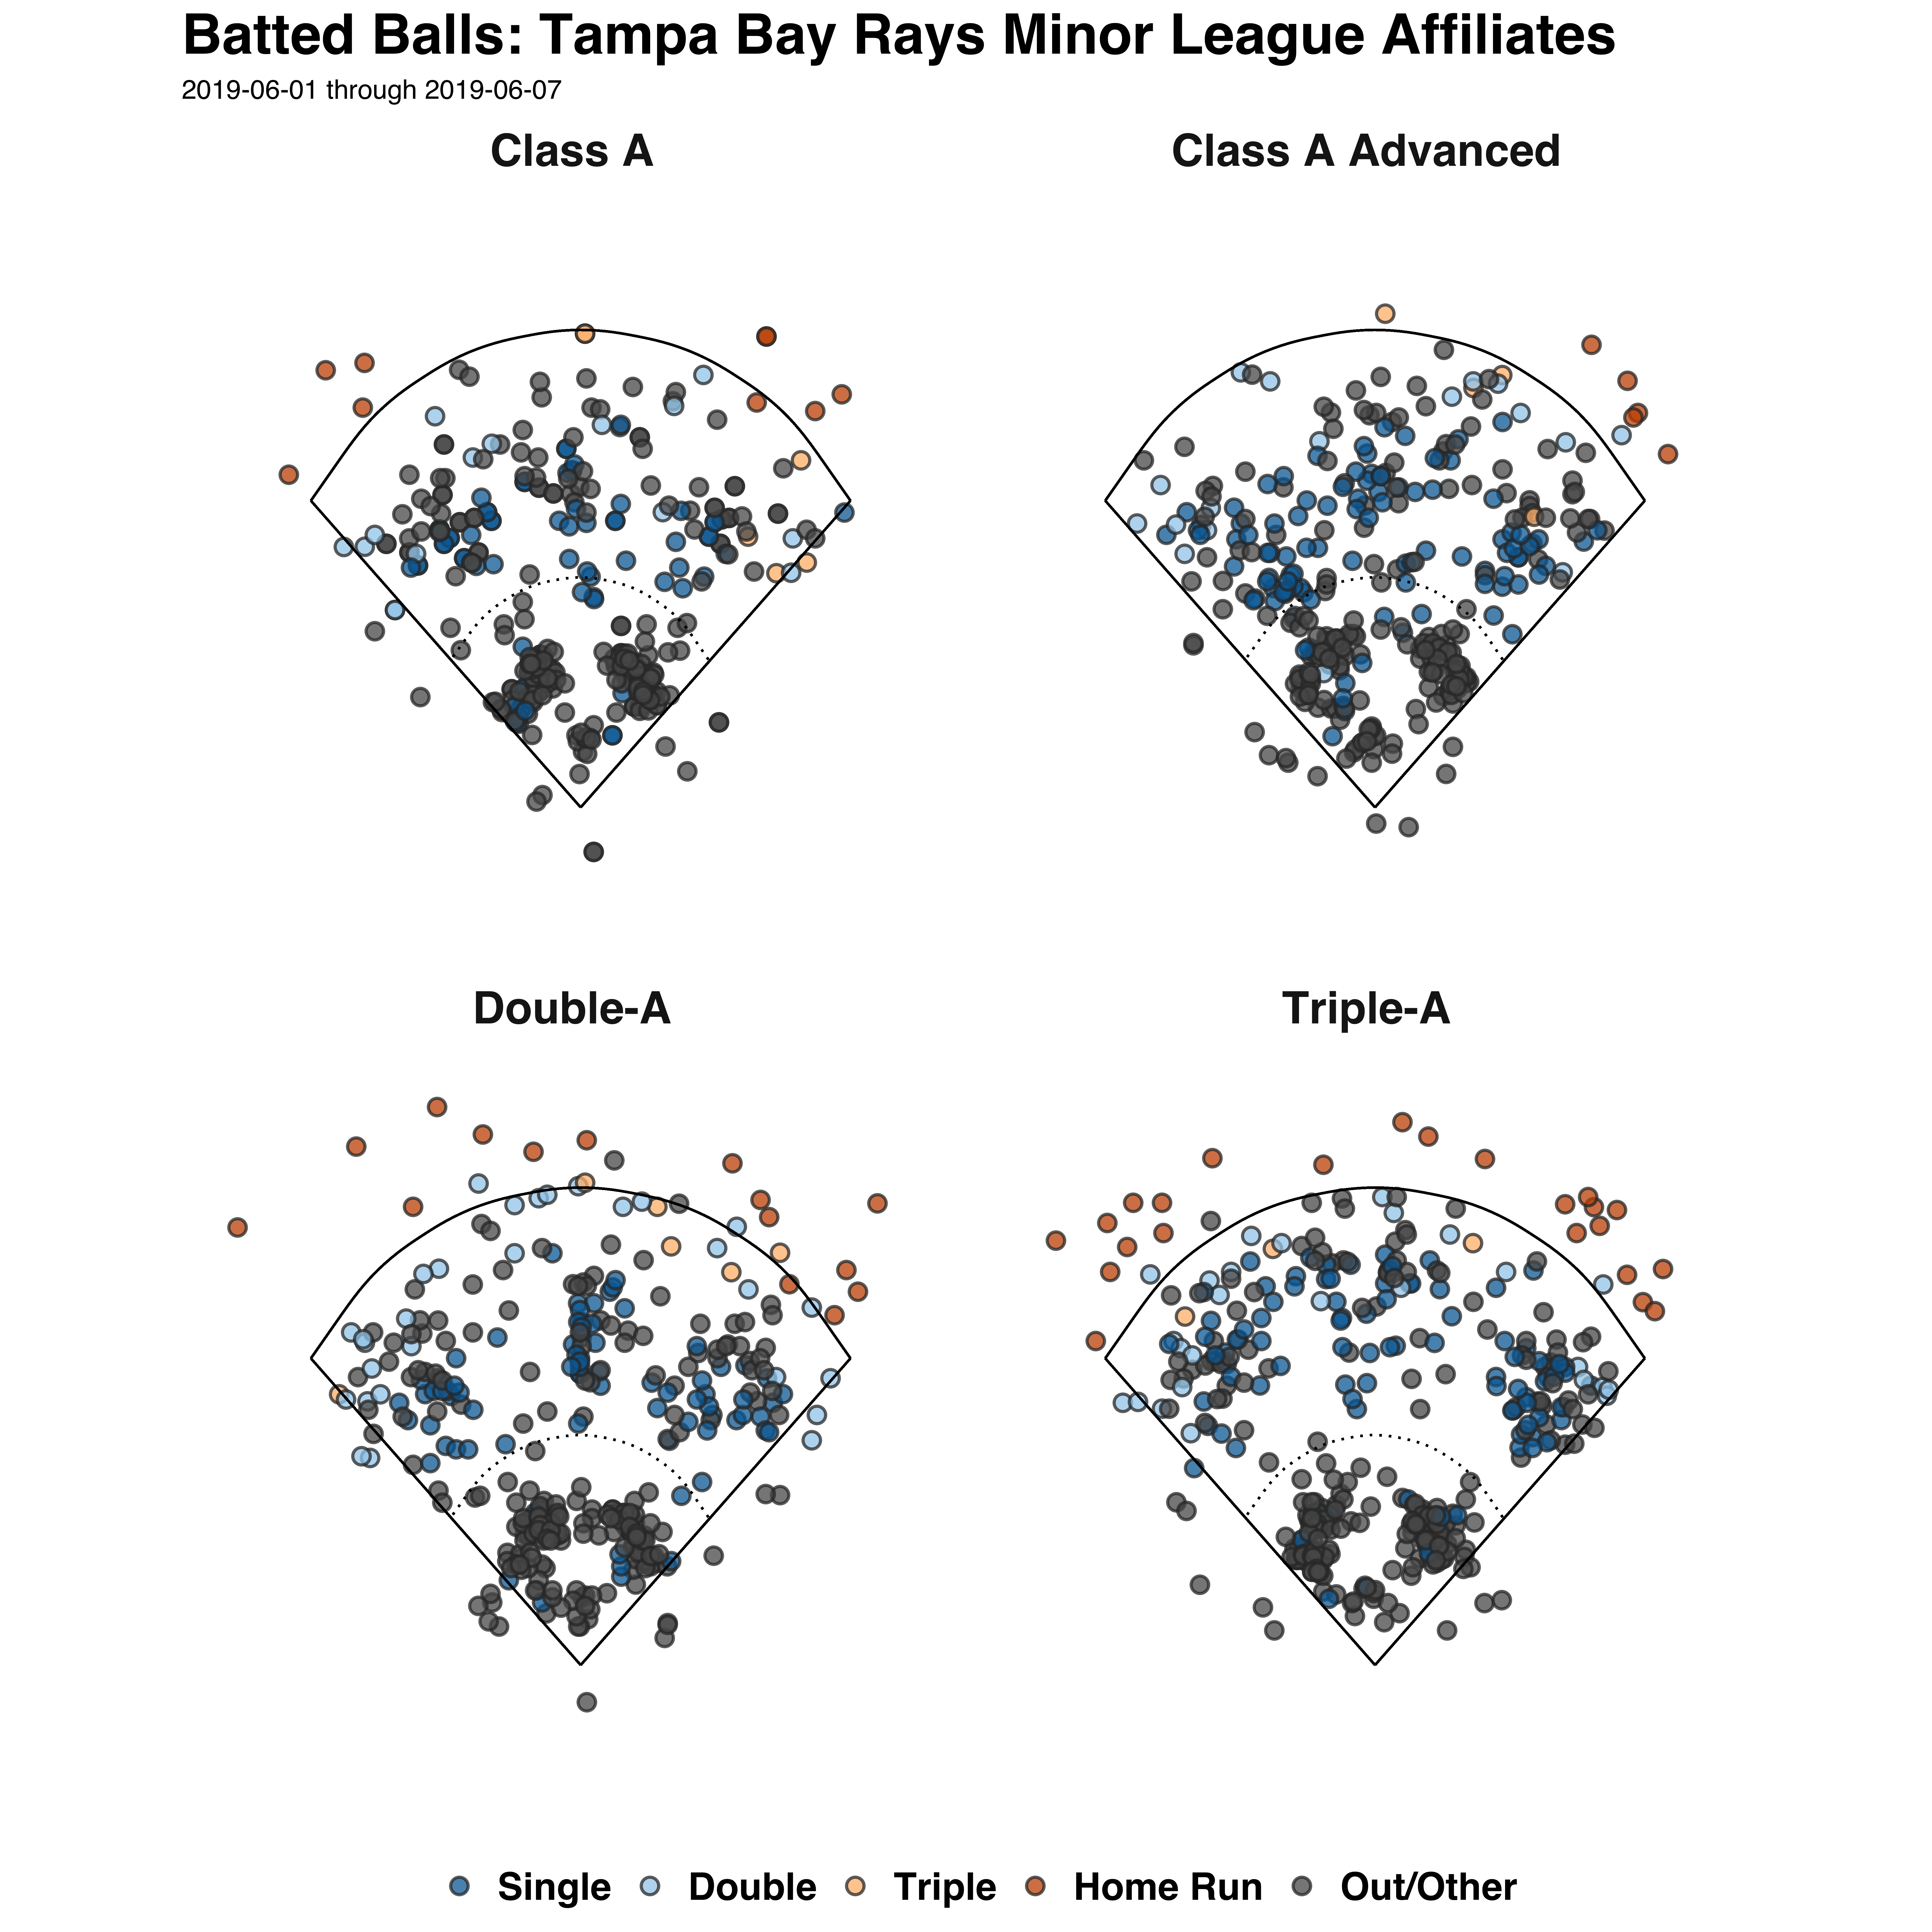
Now that you have the data you can filter for any team and their related minor league teams. Here’s what the Rays organization looks like (note: there is a data table in the package that houses all teams and their ids – teams_lu_table):
ggspraychart(df %>%
               filter(home_parentOrg_id == 139 | away_parentOrg_id == 139),
             x_value = 'hitData.coordinates.coordX',
             y_value = '-hitData.coordinates.coordY',
             fill_value = 'batted.ball.result',
             fill_palette = bb_palette,
             point_size = 3) +
  facet_wrap(~home_level_name) +
  labs(title = 'Batted Balls: Tampa Bay Rays Minor League Affiliates',
       subtitle = '2019-06-01 through 2019-06-07')
In terms of a single player, the simplist way would be to grab all the game_pks on days when a player’s team(s) played and then query the pbp for those game_pks.
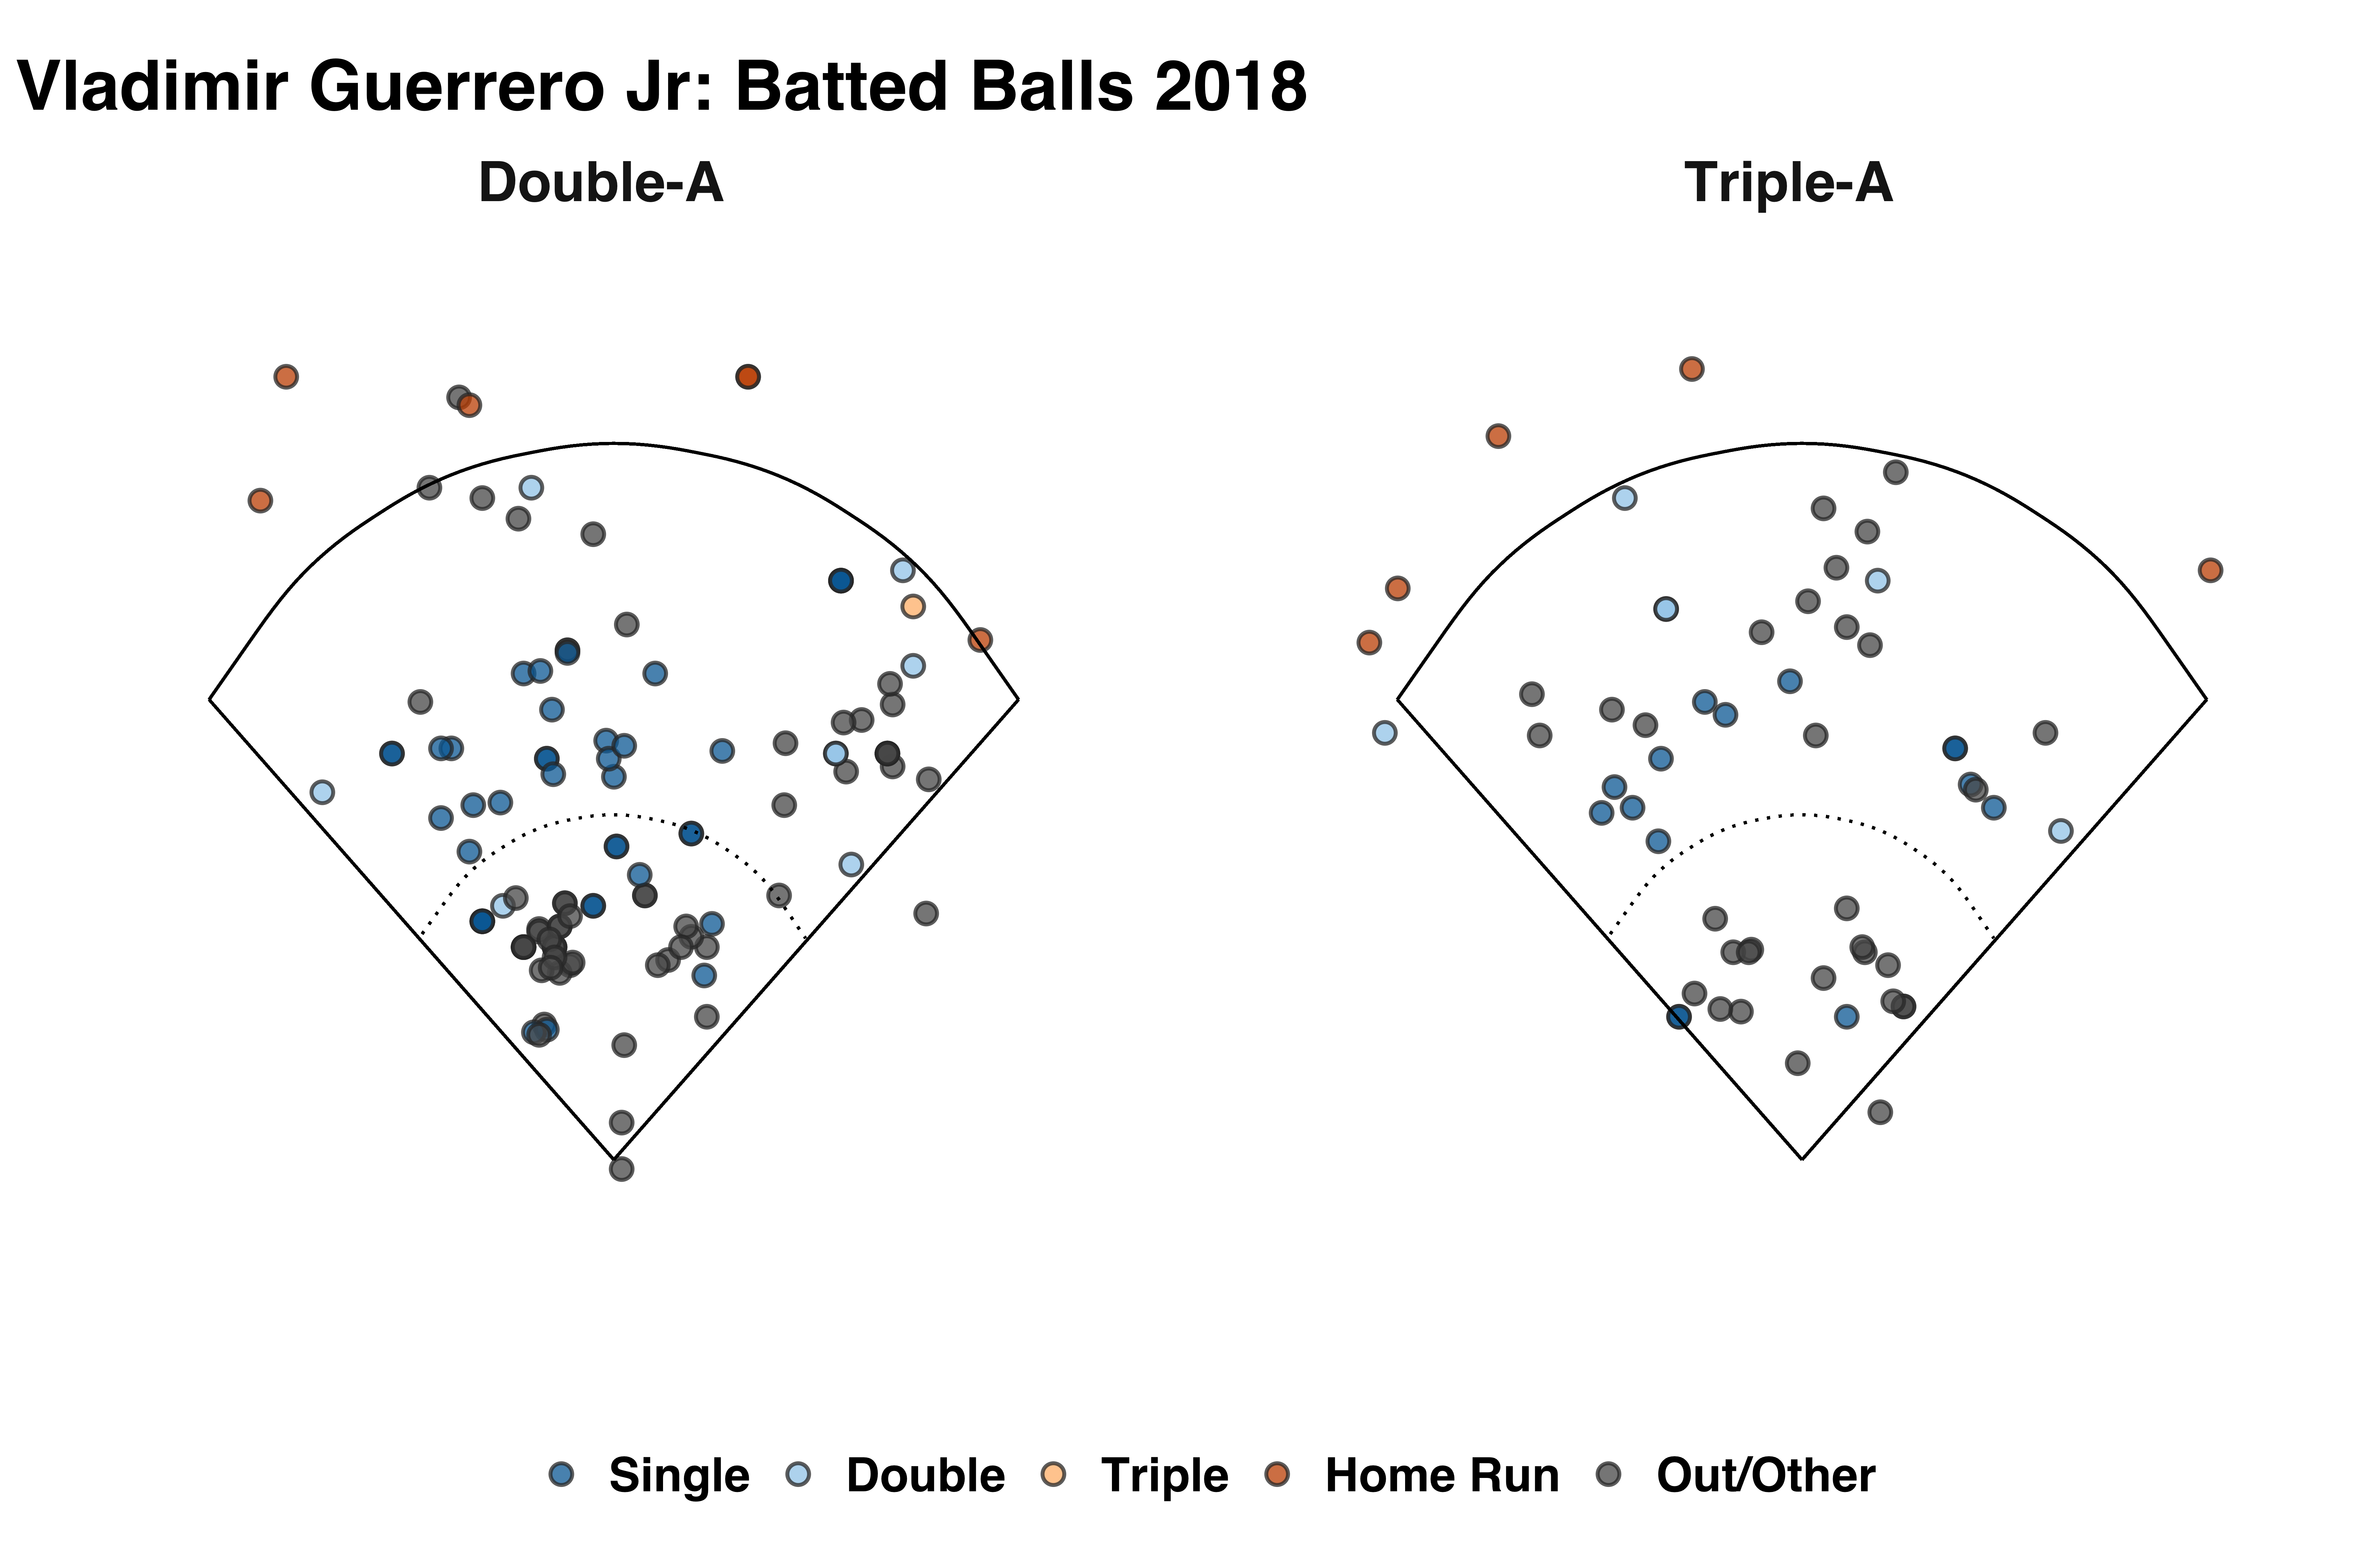
For example, let’s make spray charts for all of Vladimir Guerrero Jr.’s batted balls from 2018.
First, grab the dates of his games:
vlad <- baseballr::milb_batter_game_logs_fg(19611, year = 2019)
Next, grab the game_pk’s of those games (note I am being lazy here and grabbing all games across Triple- and Double-A):
vlad_dates <- vlad %>%
  pull(Date)
Then, loop over the games, grab the pbp data, and filter for Guerrero as the batter:
vlad_gk <- map_df(.x = vlad_dates,
                  ~get_game_pks_mlb_(date = .x,
                                     league_ids = c(11,12))
)

vlad_gk_TOR <- vlad_gk %>%
  filter(teams.home.team.name == "Buffalo Bisons" | teams.home.team.name == "New Hampshire Fisher Cats")

vlad_data <- map(.x = vlad_gk_TOR %>%
                   filter(status.codedGameState == "F") %>%
                   pull(game_pk),
                 ~safe_milb(game_pk = .x)) %>%
  map('result') %>%
  bind_rows()

vlad_pbp <- vlad_data %>%
  filter(matchup.batter.id == 665489)
We can plot the data by level:
ggspraychart(vlad_pbp,
             x_value = 'hitData.coordinates.coordX',
             y_value = '-hitData.coordinates.coordY',
             fill_value = 'batted.ball.result',
             fill_palette = bb_palette,
             point_size = 3) +
  facet_wrap(~home_level_name) +
  labs(title = 'Vladimir Guerrero Jr: Batted Balls 2018') +
  facet_wrap(~home_level_name)
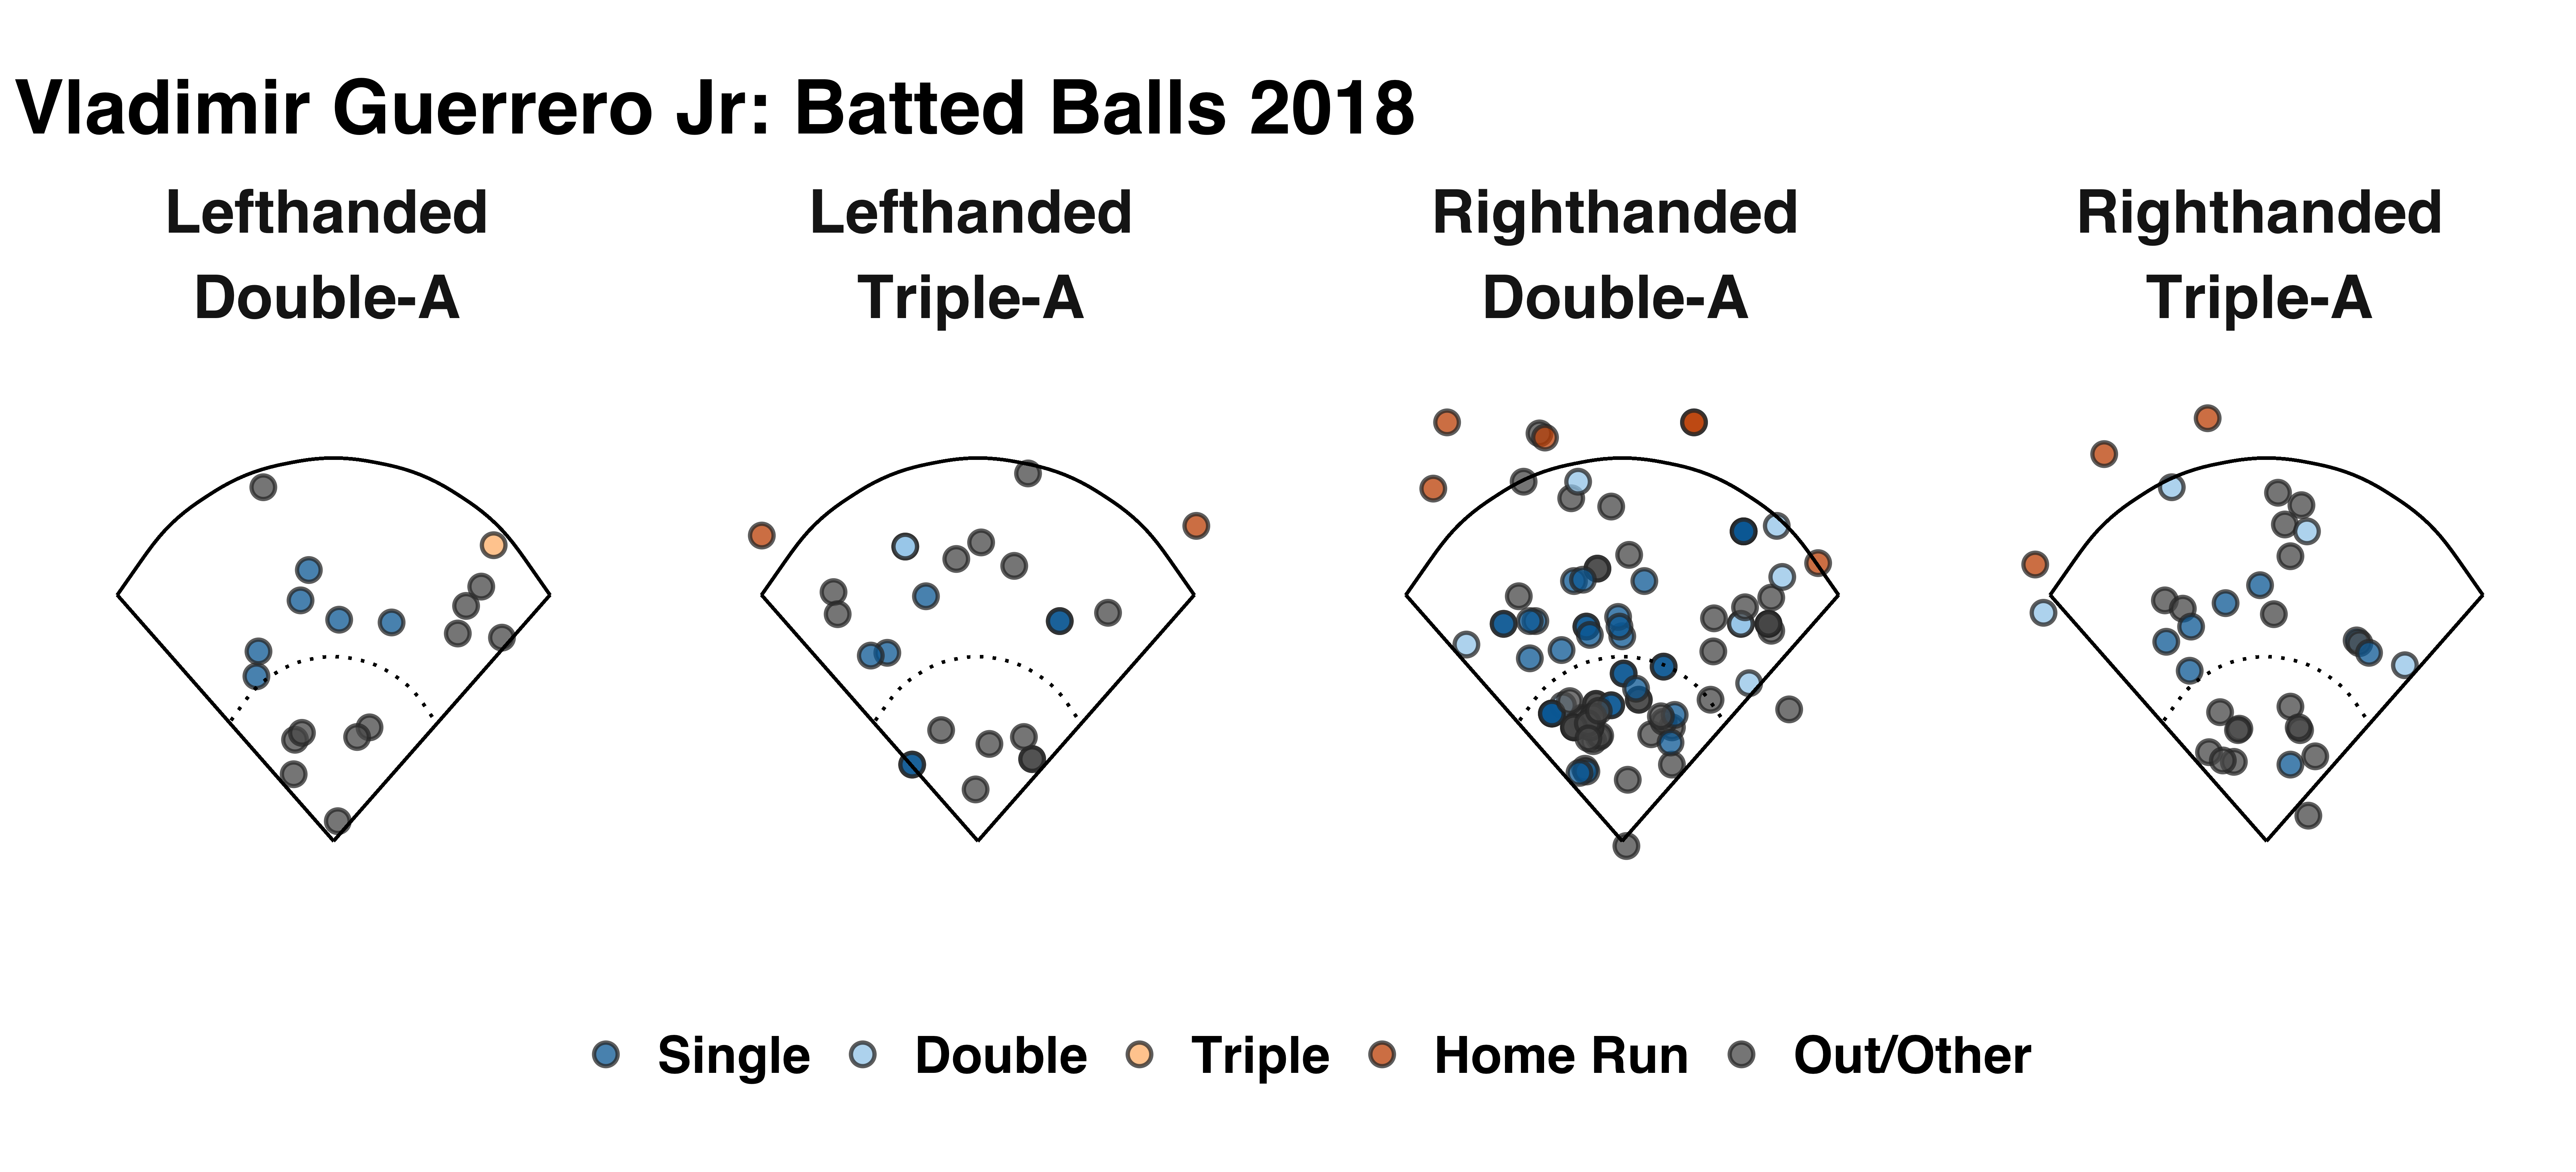
Or by pitcher handedness and level:
ggspraychart(vlad_pbp %>%
               mutate(matchup.pitchHand.description = paste0(matchup.pitchHand.description, 'handed')),
             x_value = 'hitData.coordinates.coordX',
             y_value = '-hitData.coordinates.coordY',
             fill_value = 'batted.ball.result',
             fill_palette = bb_palette,
             point_size = 3) +
  facet_wrap(~home_level_name) +
  labs(title = 'Vladimir Guerrero Jr: Batted Balls 2018') +
  facet_wrap(~matchup.pitchHand.description+home_level_name, ncol = 4)
It is not the most efficient process, but from what I can tell that’s the best way to do it today.
That’s all for now. Let me know if you have any issues. Oh, and before I forget, you can also grab MLB pbp data using the same functions.
Comments and pull requests welcome!